Introduction Study area Method: Photogrammetry Method: Water depth estimation Final riverbed surface Conclusions References Links & Acknowledgements
|
Introduction Study area Method: Photogrammetry Method: Water depth estimation Final riverbed surface Conclusions References Links & Acknowledgements |
|
3: Method: Photogrammetric survey of dry areas
3.1. Raw imagery and DEM collection
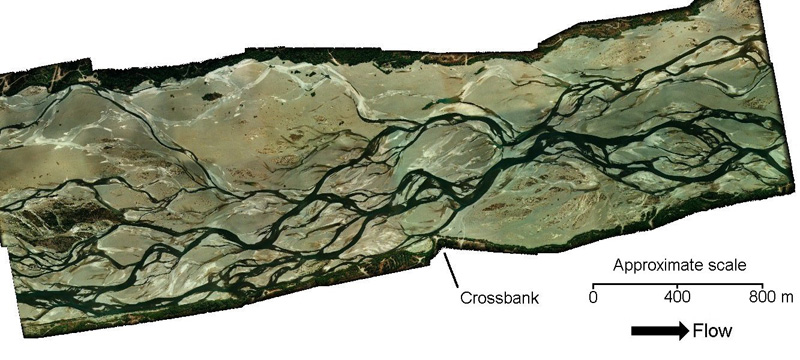
Aerial photographs of the reach were flown by Air Logistics (NZ) Ltd in February 1999, March 1999 and February 2000. The February 1999 aerial photographs, following mosaicking and rectification, are shown in Figure 3. The spacing of the photographs was such as to provide the 60% overlap desirable for photogrammetry.
Figure 3 Mosaicked vertical aerial photograph of the Waimakariri study reach from February 1999. Air Logistics (NZ) Ltd 1999.
A feature of photogrammetric survey is the trade-off between precision and spatial coverage: Precision can be improved by lowering the flying height used to collect the raw imagery, however this means that the area covered by each will be reduced, and an larger number of DEMs (and associated increased time and resoucres) are required. In this instance, the study reach was covered using two parallel flying lines, to allow a scale of 1:5000 to be used. Had a single flying line been used, imagery scale would have been confined to 1:8000 by the riverbed width, leading to a reduction in the best theoretical precision. Photo-control was provided by a number of targets, carefully placed on the riverbed before the photographs were taken so that there were at least five targets on each image. Their position was determined using a Trimble GPS survey.
DEMs of the Waimakariri study reach were generated using Imagine OrthoMAX installed on a Silicon Graphics workstation. Given the scale of the aerial photographs, the scanning resolution used (14 m), and the subsequent quality of the photogrammetric 'bundle adjustment', the software calculated 0.3 m to 0.4 m as the optimum possible DEM grid spacing. DEMs were ultimately collected at a grid spacing of 1.0 m to reduce computation time and resources needed.
3.2. DEM post-processing
In the past, DEM post-processing was a largely manual task, with an operator editing DEM points where there appeared (visually) to be errors. While this approach is still useful and necessary in some situations, it is a very slow process, with an experienced photogrammetrist able to match only 500 points per hour (Lane, 1994). With a large, high resolution DEM (such as the Waimakariri study reach, which contains 5 million potential points), it is unfeasible to suppose that a human operator can check every point on the DEM surface. This implies that several phases of post-processing are needed. First, automated methods should be used to 'filter' the raw DEMs and remove errors that fall within certain topographic criteria. Then, if necessary, manual editing can be used in specific areas where highly accurate topography is desired, or where there are likely to be errors in the DEM surface. For the Waimakariri DEMs, an automated post-processing procedure was developed, whereby three categories of points were removed: (i) points that fell in wetted and vegetated areas; (ii) points where automated stereo-matching had been unsuccessful; and (iii) points that fell outside a local topographic deviation criteria. If errors still remain, manual editing is possible within the OrthoMAX Professional module. This allows an operator to add, delete or edit individual points in a DEM surface, or to add breaklines, based on visualisation of the corresponding stereo-photograph.
The raw DEM surface for the whole study reach in February 1999 is shown in (Figure 4a). It is immediately noticeable that there are several areas where large errors have occurred. These errors take the form of dark and light areas on Figure 4a, and generally correspond to submerged zones, as can be seen in Figure 4b which is the same surface but with wet areas masked out. This reinforces the need to abandon photogrammetry for topography submerged by slightly turbid water: photogrammetry alone could clearly not be used to recover the submerged topography of the Waimakariri riverbed. Hence, for each epoch, a wet/dry classified image was generated (Figure 5), and all elevation fixes made in 'wet' areas were removed. Vegetation also produces errors in photogrammetrically-derived surfaces (Lane et al., 2000), and needs attention. In this case, however, because vegetation has a similar spectral signature to water on black and white imagery, vegetated areas were classified as 'wet', and were also eliminated.
Figure 4 DEM surfaces for the whole study reach shown in Figure 3: (a) the raw DEM surface; (b) the raw DEM surface with wet areas masked out; and (c) the re-interpolated DEM surface following the removal of unsuccessful matches, and wet and vegetated points, also with wet areas masked out. All three DEM surfaces have been detrended.
Figure 5 The classified riverbed for February 1999. Vegetated areas were initially classed as 'wet', but later changed semi-manually to reflect their true appearance.
Following wet and vegetated point removal, errors remain visually apparent in the February 1999 DEM surface (Figure 4c), in the form of regions that are much too high (spikes) or too low (holes). As we know that actual riverbed surface has relatively little vertical relief (Figure 2), it is, in theory, possible to automatically identify errors such as these. This was achieved by using a low resolution DEM of the study reach (collected at 5 m grid spacing) which gave a smoothed but more reliable DEM surface. Then, where the high resolution (1 m spaced) DEM elevation was greater than +/- 0.5 m from the low resolution DEM surface, an error was assumed, and the point removed from the DEM surface. The poorer precision associated with low resolution DEMs meant that it was decided not to replace the eliminated value with the low resolution DEM elevation for that point.
Once the post-processing procedure was completed for each individual DEM, they were mosiacked togther to give the dry-bed elevation map of the complete study reach.
Introduction Study area Method: Photogrammetry Method: Water depth estimation Final riverbed surface Conclusions References Links & Acknowledgements