|
|
|
|
Broad-scale topography
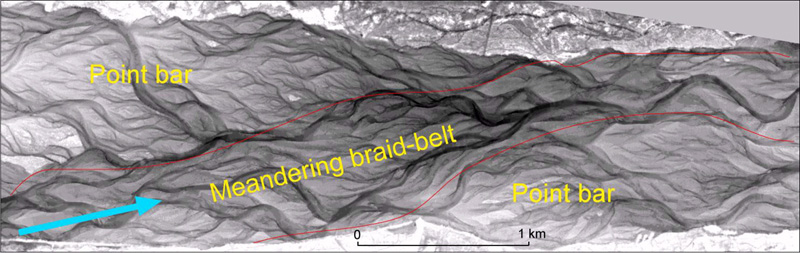
The topography of the study reach in May 2000, as captured by the laser survey and water depth mapping, was rendered onto an image map (Figure 5). With this, the original bed level data has been interpolated to a 1 m node-spacing, square-grid DEM, which has been detrended by removing a planar surface fitted by regression to the whole reach. Thus, the grey-scale of each pixel on the image map indicates the local elevation at 1 m spacings. The local relief over the whole study reach never exceeds 3 m, while the standard deviation of the detrended elevation is approximately 0.4 m.
Figure 5. Image map of the detrended topography of the Waimakariri study reach based on airborne laser survey and water-depth mapping. Each pixel represents a 1 m spaced node on the digital elevation model and its grey-scale colour indicates elevation. The grey-scale ranges from + 1.5 m elevation (white) to -1.5 m (black). River flow is from left to right. The white 'spike' in the centre of the true right bank (at the base of the image) is the Crossbank groyne.
At a broad scale, the riverbed shows a narrower belt of active braiding that often (but not always) meanders around broad, low relief alternate bars that are intricately dissected by dendritic drainage networks. Field inspection and the video record show that the braid belt remains actively braiding even at low flow, as the main flow tends to concentrate into these channels. The broad location of the braid belt tends to be persistent, at least during 'freshes' (i.e, small, common flood events). Inspection of past aerial photographs suggests that it can switch as a result of large floods.
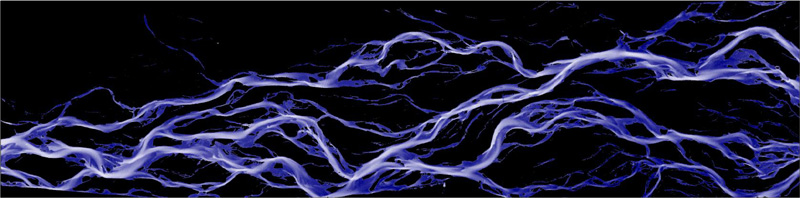
This broad pattern is not apparent on aerial photographs nor on the concurrent map of water depth (Figure 6), where the eye tends to focus on the binary wet/dry pattern and the subtleties of the large and fine-scale topography are lost.
Figure 6. Water depths over the study reach mapped from aerial photographs using an empirical relationship between water depth and colour (Westaway et al., this volume). Water depth grades from 0 m (dark blue) to 1.2+ m (white). The area covered is the same as that in Figure 5. Flow direction is left to right.
The dendritic channel networks on the alternate 'point bars' are clearly fractal in pattern and some develop to fourth order. They show very little truncation by cross-cutting channels, which suggests that they are reasonably persistent. However, we have observed headward extension of some of the first order channels from a comparison of our February 1999 and May 2000 surveys. Thus we expect that ultimately the dendritic networks will connect with the braiding network and the topography over the bars will display a mixture of braiding and dendritic channels. The largest local relief anywhere in the study reach is to be found in scour pools downstream of confluences where third order channels join. These pools may be over 2 m deep, whereas channels in the braided belt are rarely deeper than 1 m at normal flows. We suggest that these dendritic networks are formed during bankfull and near-bankfull flows when water without bed material spills over the upstream margins of the broad bar features. We also hypothesise that the bars themselves are formed during large floods, when the bankfull flows are confined to a quasi-straight path by the bank vegetation and ultimately the stopbanks, and the water becomes deep enough for an incipient alternate bar pattern to develop.
The relative relief of the broad-scale alternate bar forms is of the order of only a few metres, while the wavelength of the meander cycle through the study reach is estimated at 4900 m. For a channel width of approximately 1000 m, this indicates a wavelength:width ratio of 4.9, which is within the range of single row alternate bars described elsewhere in the literature (e.g., Ikeda, 1984, Jaeggi, 1984). However, the width:depth ratio at bankfull conditions, which is greater than 500, is much larger than expected for single-row alternate bars, indeed for this width:depth ratio development of the higher mode bars that lead to braiding is expected (Ikeda, 1984). Thus there does not appear to be a clear explanation of the origin of this large-scale morphology in the literature. Interestingly, an alternate-bar-wavelength to channel-width ratio of approximately 5 is maintained for some 14 km downstream from the study reach as the channel is progressively confined to a 350 m width (Figure 3). Possibly, the influence of the higher relief single-row alternate bar pattern in the confined reach extends upstream into the braided reach.